Are We There Yet?
Markets like bouncing, and they certainly bounced Tuesday. The 10-year Treasury yield, at the time of writing, has rebounded to 0.803%, having hit a low early Monday of 0.314%. This is by far the greatest volatility the bond market has experienced since the crisis of 2008-09. U.S. stocks had their best day since 2018, after European stocks staged a 4.3% rally only to give it all up and close lower.
It is tempting to hope that the decline is over, but it would be unwise to bet on it. The physics of markets are such that big and sudden crashes are followed by big rebounds. History suggests that stocks will need to adjust for quite a lot longer before they find a level.
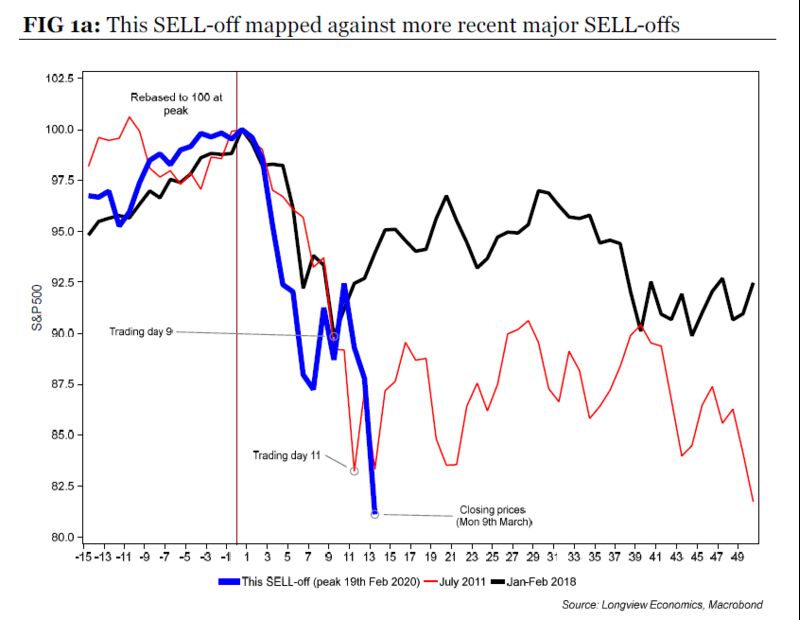
Chris Watling of Longview Economics in London produced this chart comparing the latest U.S. sell-off with the most recent slumps, in July 2011 (driven by the debt ceiling imbroglio in the U.S.) and early 2018 (when trades relying on low volatility imploded). It doesn’t include Tuesday’s bounce, but we can see that the chart would have led us to expect it. We should also expect share prices to be no higher in a month’s time than they were at Monday’s lows.
What of history’s great market crashes, in 1929 and 2008 (which led to bear markets), or 1987? We need to know a lot more before we know if this incident will turn into a bear market — but what has happened so far is consistent with those historic crashes:
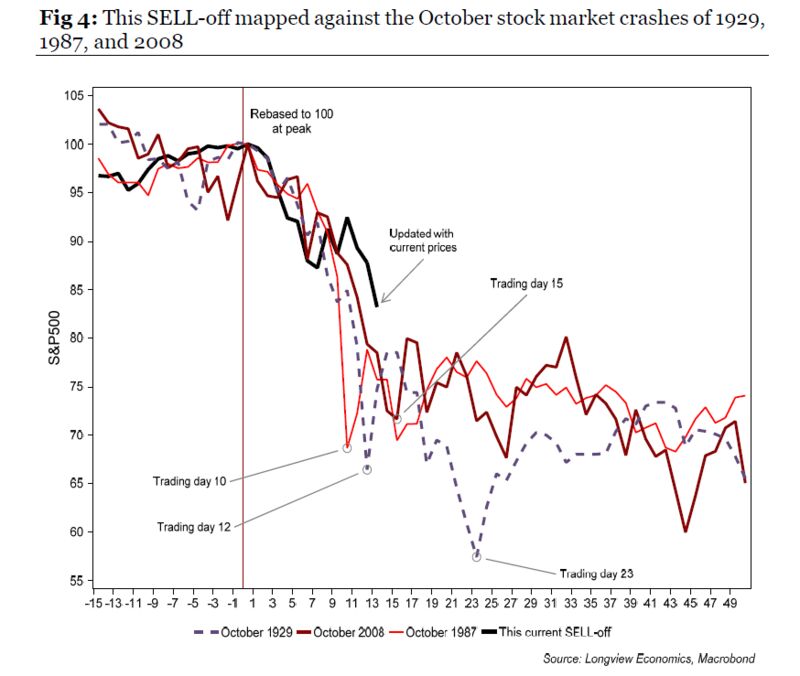
There were big bounces at about this point in proceedings during the October upheavals of 1929, 1987 and 2008, so the Tuesday rally tells us nothing yet.
The technicalities of the market make it likely that we aren’t “there” at the bottom. Beyond that, I would submit that the sentiment is all wrong. At market troughs, people are no longer scared, or asking whether this is the time for a rebound, but rather they are asking how much worse it can get. As evidence, let me take you back to the greatest market bottom I have witnessed, in March 2009. I am writing this on the anniversary of the day that stock markets started their great rebound, having hit rock bottom on Monday, March 9. That nadir was marked by the total abandonment of hope. And, thankfully, I said so at the time.
Digging through the online archives of my old employer, the Financial Times, I found the blurb for my Short View video that we published that day. You can watch the whole video (no paywall) here:
The written column, as published on March 10, the day the rally began, can be found here (for this you will need an FT subscription). Mercifully, it turned out to be a decent call. Beyond noting that I have aged, and that it’s just as well I gave up on the Trotsky-esque facial hair, the main point is that sentiment 11 years ago was nothing like the emotions coursing through markets Tuesday. People were dispirited, and they had given up all hope. Good news, such as commodities gaining and share prices in emerging markets perking up as China’s fiscal stimulus began to work, was ignored.
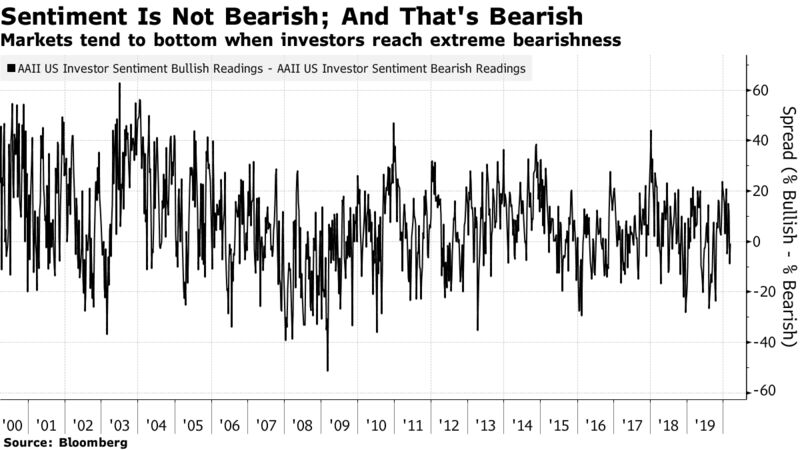
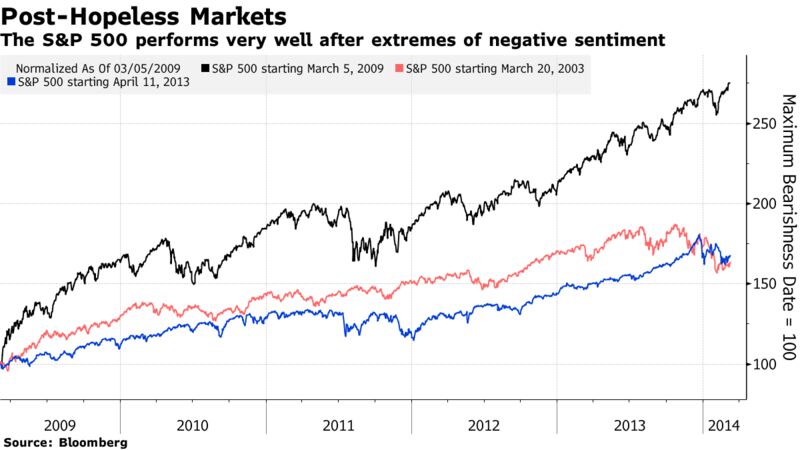
We are nowhere close to abandoning hope in such an abject way. To illustrate, the following is an update of the chart I used in the 2009 video. The American Association of Individual Investors holds weekly polls of its members, asking if they are bullish or bearish. When bulls are most heavily outnumbered by bears (indicated by numbers below zero on the chart), it is time to sell. The greatest bearishness in the survey’s history came immediately before the low point of 2009. Today, the number of bears and bulls is roughly equal. This is nothing like the bottomless pit of negativity, when fear gives way to apathy, that we need for a bear market floor.
To illustrate that March 2009 wasn’t a one-time event, here is how the S&P 500 did in the following five years, compared with the five years after two other notable spikes in bearishness, in March 2003 (during the invasion of Iraq) and April 2013. Hugely negative sentiment is a good buying indicator, and we don’t yet have it:
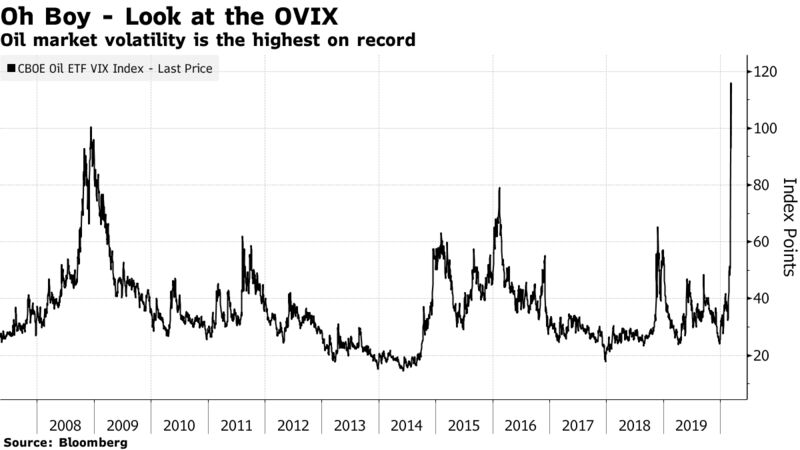
One final caution: Uncertainty and volatility in the oil market are at unprecedented levels. The OVIX index, effectively the VIX index for the oil market, which rises with increasing uncertainty about future price levels, has touched its highest since inception in 2007. Until it calms down, nobody should assume that the stock market, or any other market, has hit bottom.
Contagion
We are back to thinking of contagion in the original, medical sense of the word. But we need to think about its financial form as well. As with human diseases, the questions for a financial malady are: How is it spread, and who is at greatest risk?
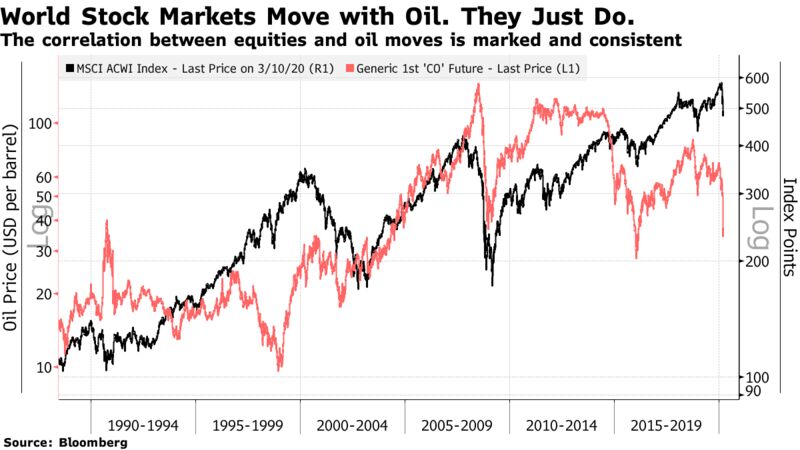
A lower oil price in the short term is unambiguously bad for share prices. The correlation between the MSCI ACWI index, covering developed and emerging markets, and the oil price over the last three decades is clear. The only significant deviation came during the dot-com bubble:
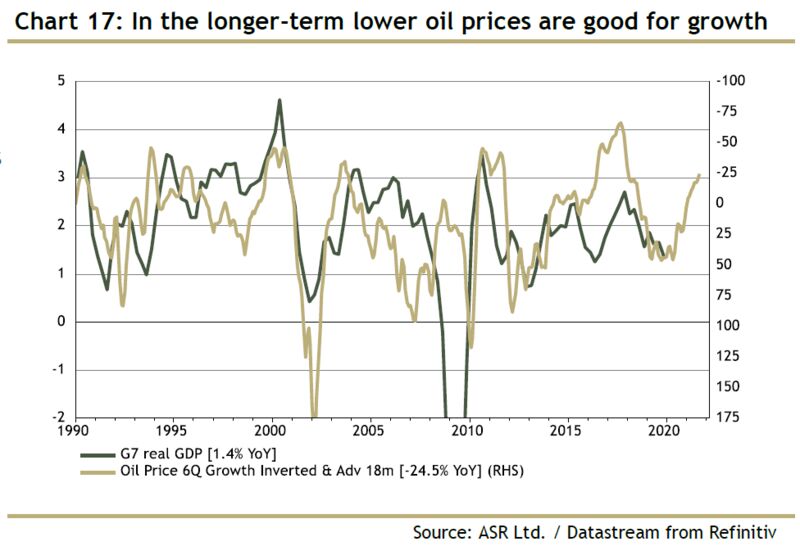
In the longer term, of 18 months or so, lower oil prices function as a fiscal boost, giving consumers and companies more money in their pockets and stimulating growth, as this chart from London’s Absolute Strategy Research shows:
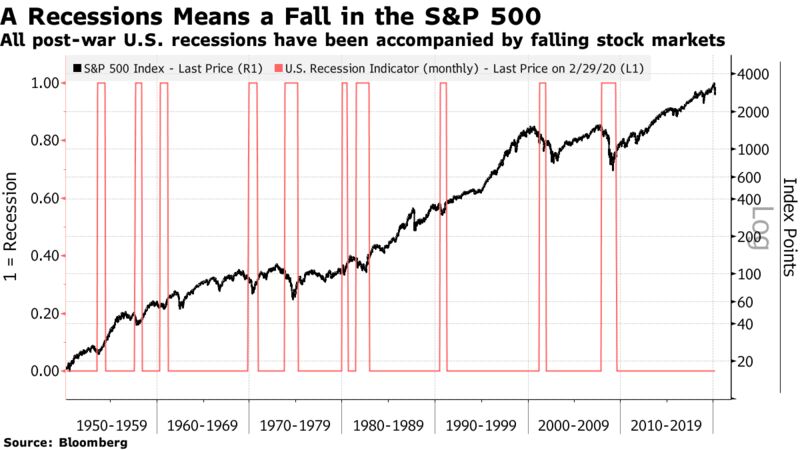
It is reasonable to hope that any recession will be short-lived then, before the effect of cheaper oil works its magic. It is also reasonable to expect the effects of foregone demand as a result of the coronavirus to be short-lived. The problem is that recessions tend not to last that long in any case, and they are invariably accompanied by significant declines in share prices:
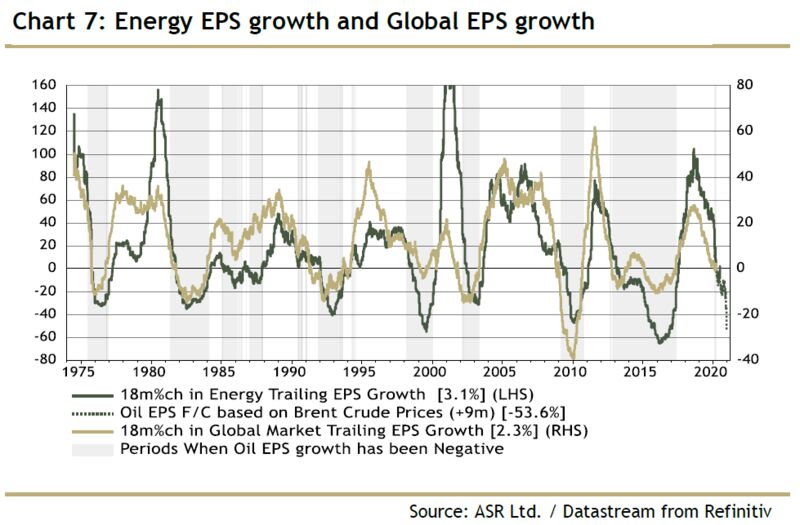
Why does cheaper fuel have such an immediately negative effect? One problem is that it hits the profits of energy companies, which are correlated with earnings of the market as a whole, as this Absolute Strategy chart shows:
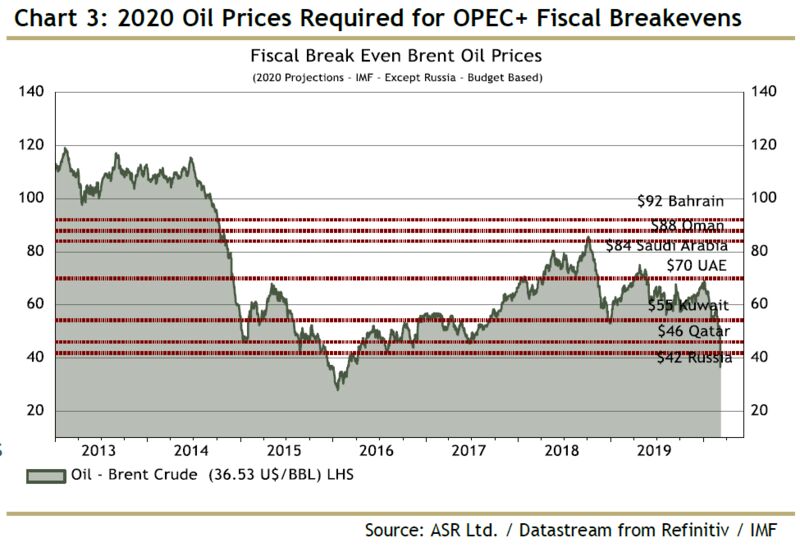
There are other contagion effects. Oil producers will find it far harder to make ends meet. Oil prices at their current levels mean that most of the main producers will fail to break even. To get by, these countries’ sovereign wealth funds, huge players in modern international markets, may have to make forced sales. That could lead to some surprising victims. For example, Japanese stocks suffered a sudden and unexpected bear market in early 2016 that was largely attributed to sales by SWFs.
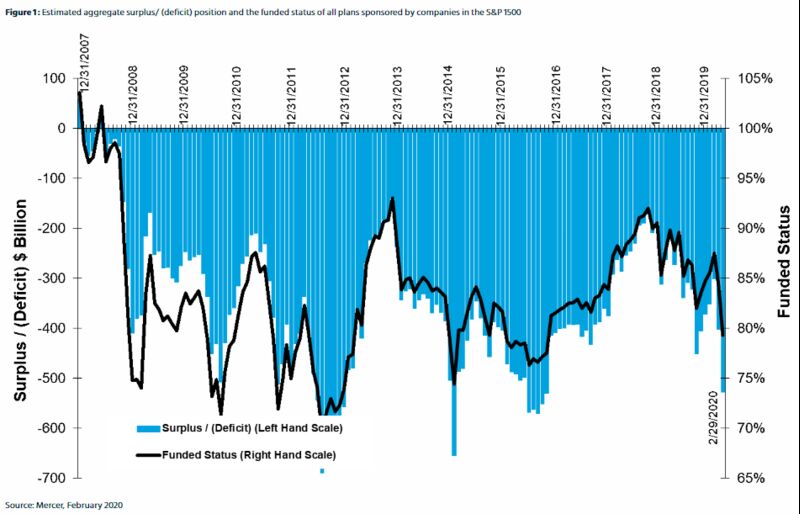
Large defined-benefit pension funds may find themselves in an impossible position. Their economics broadly depend on stock market returns (stronger returns increase their assets), and bond yields (lower yields make it more expensive to fund guaranteed income in retirement, and so increase their liabilities). As this chart from Mercer shows, S&P 1500 pension funds had already seen their funded status drop below 80% as of the end of February (meaning that their assets were worth only 80% of their liabilities). That will have worsened:
This should alert us to another form of contagion. If companies, or cities or states, find that their pension funds are insolvent, risks of remedies such as bankruptcy grow much greater. Detroit, which declared bankruptcy in 2013 largely because of the crippling burden of its pension obligations, offers some inkling of what might happen. Oil contagion could affect players apparently far removed from the oil market.
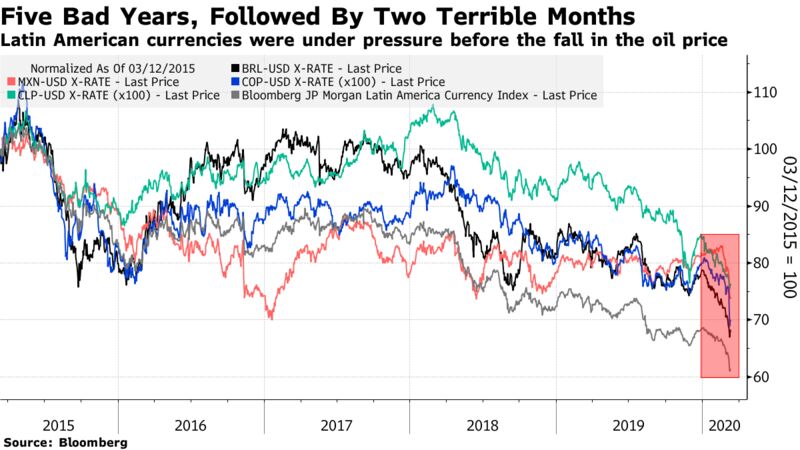
It may be counter-intuitive, but a virus that initiated in central China, and a dispute between Saudi Arabia and Russia, may well cause their greatest collateral damage in Latin America.
Source: Bloomberg.com